Peptide Storage Temperature Chart
A practical temperature chart explaining freezer, fridge, and room-temperature storage context without pretending every peptide shares the same decay curve.
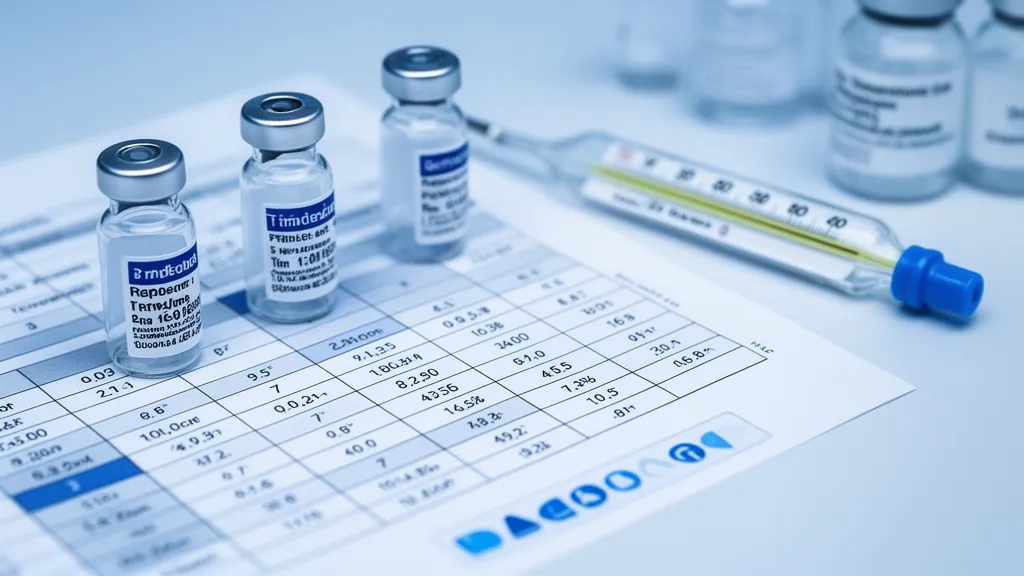
A temperature chart is useful when it communicates direction without pretending to offer peptide-perfect precision. That is the line many storage guides miss. People want a simple answer, but the honest answer is that temperature guidance is strongest when it shows the broad pattern clearly and leaves room for peptide-specific exceptions.
Across most workflows, the overall order is consistent. The freezer is usually the lowest-energy storage state, but it is not always safe after reconstitution. The fridge is the default cold-storage range for many reconstituted workflows. Room temperature usually accelerates degradation and should not be treated as neutral.
What a good temperature chart should help the reader understand
The chart should communicate three practical truths. First, colder storage generally slows degradation. Second, room-temperature exposure is not a neutral holding pattern. Third, some peptides are especially high risk for freeze events after reconstitution even if freezing sounds intuitively protective. Those are the ideas that actually improve decision-making.
Why one chart cannot describe every peptide perfectly
The moment a storage chart pretends to cover every peptide with equal confidence, it stops being trustworthy. Peptides differ by formulation, stability class, solvent, and freeze sensitivity. That is why PeptideClock uses model estimates, peptide-specific notes, and article-level nuance instead of presenting one universal shelf-life law disguised as a neat table.
The better way to use a chart is as orientation. It tells you where the higher-risk direction lies. The more precise questions still belong to peptide-specific pages, the Potency calculator, and the deeper background material in the stability research cluster.
Use the chart with the rest of the storage evidence
If the question is broad storage logic, this page and the Peptide storage guidelines are useful starting points. If the question is practical handling at room temperature, refrigeration, or after a freeze event, the Reconstituted peptide shelf-life guide and the Storage temperature FAQ give better follow-through. The goal is not to replace detailed evidence with a chart. The goal is to keep the chart honest about what it can and cannot do.
Related reading
- Peptide storage guidelines
- Reconstituted peptide shelf-life guide
- Stability research cluster
- Potency calculator
References & evidence
- ICH Q1A(R2) — source for stability-testing framework.
- Waterman and Adami — source for temperature acceleration logic.
- Wang and Roberts — source for non-linear aggregation caution.